Difference between revisions of "Mastery Grids Interface"
| Line 3: | Line 3: | ||
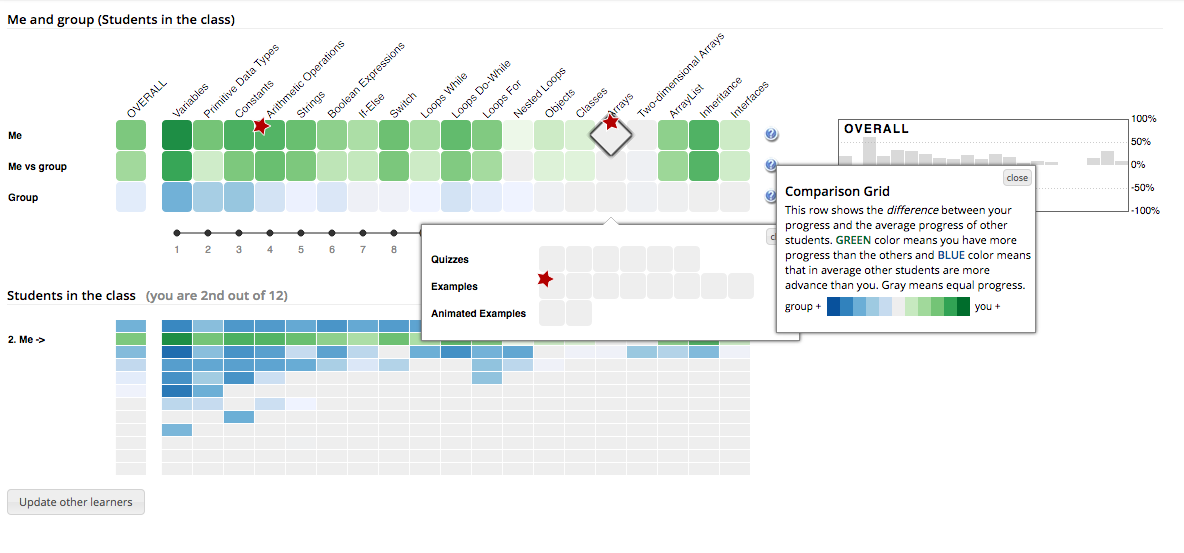
Mastery Grids presents and compares user learning progress and knowledge level (mastery) by colored grids from four perspectives as shown in Figure 1. The four perspectives show the current student’s progress (“Me” or my progress), a comparison of performance of current student versus other student in the group (“Me vs group” or comparison grid), performance of the students in the group (“Group” or group grid), and performance of all of the students in the class. | Mastery Grids presents and compares user learning progress and knowledge level (mastery) by colored grids from four perspectives as shown in Figure 1. The four perspectives show the current student’s progress (“Me” or my progress), a comparison of performance of current student versus other student in the group (“Me vs group” or comparison grid), performance of the students in the group (“Group” or group grid), and performance of all of the students in the class. | ||
| − | [[Image:mg_1.png]] | + | %[[Image:mg_1.png]] |
Social comparison is implemented in two ways: 1) Me vs group, which compares an individual learner’s progress or knowledge level with the entire group of students, and 2) Me vs other students, which compares an an individual learner’s progress or knowledge level with each of other students. Such comparisons can be further conducted by resource types (learning materials) as shown in Figure 2. | Social comparison is implemented in two ways: 1) Me vs group, which compares an individual learner’s progress or knowledge level with the entire group of students, and 2) Me vs other students, which compares an an individual learner’s progress or knowledge level with each of other students. Such comparisons can be further conducted by resource types (learning materials) as shown in Figure 2. | ||
Revision as of 20:42, 3 April 2016
Mastery Grids is an open social student modeling interface written in Javascript. The interface shows the student's progress levels in a series of topics and content items as long as provides navigation support and access to educational content (see figure).
Mastery Grids presents and compares user learning progress and knowledge level (mastery) by colored grids from four perspectives as shown in Figure 1. The four perspectives show the current student’s progress (“Me” or my progress), a comparison of performance of current student versus other student in the group (“Me vs group” or comparison grid), performance of the students in the group (“Group” or group grid), and performance of all of the students in the class.
Social comparison is implemented in two ways: 1) Me vs group, which compares an individual learner’s progress or knowledge level with the entire group of students, and 2) Me vs other students, which compares an an individual learner’s progress or knowledge level with each of other students. Such comparisons can be further conducted by resource types (learning materials) as shown in Figure 2.
Mastery Grids is our latest implementation of open student modeling built based on our past successful systems (e.g., InterBook, QuizGuide, NavEx, QuizMap, Progressor). Combining open learner model with social comparison, i.e., open social learner model, Mastery Grids not only enables a student to be aware of the strength and weakness among his/her own knowledge modules, but also stimulates students to work harder. Our open social learner model encourages students to catch up with other students (observing average class progress or advanced students’ progress) and follow the potential good learning path of the peers.
- An interactive demo of MasteryGrids can be found here

