Difference between revisions of "Mastery Grids Interface"
(→Knowledge and Progress Visualization) |
(→Resources) |
||
| (4 intermediate revisions by 2 users not shown) | |||
| Line 2: | Line 2: | ||
== Open Social Learner Model == | == Open Social Learner Model == | ||
| − | Mastery Grids is | + | Mastery Grids is a personalized educational system built to support practice with multiple types of smart learning content. Mastery Grids interface offers topic-based open learner modeling, which integrates features explored on our past successful systems (e.g., [[InterBook]], [[QuizGuide]], [[NavEx]], [[QuizMap]], [[Progressor]]). Combining open learner model with social comparison, i.e., open social learner model, Mastery Grids makes students aware of the strength and weakness of their own knowledge on the system topics and allows them to compare their knowledge with the knowledge of their peers. Our open social learner model encourages students to catch up with other students (observing average class progress or advanced students’ progress) and follow the potential good learning path of their peers. |
== Knowledge and Progress Visualization == | == Knowledge and Progress Visualization == | ||
Mastery Grids presents and compares user learning progress and knowledge level (mastery) by colored grids from four perspectives as shown in the following figure. The four perspectives show the current student’s progress (“Me” or my progress), a comparison of performance of current student versus other student in the group (“Me vs group” or comparison grid), performance of the students in the group (“Group” or group grid), and performance of all of the students in the class. | Mastery Grids presents and compares user learning progress and knowledge level (mastery) by colored grids from four perspectives as shown in the following figure. The four perspectives show the current student’s progress (“Me” or my progress), a comparison of performance of current student versus other student in the group (“Me vs group” or comparison grid), performance of the students in the group (“Group” or group grid), and performance of all of the students in the class. | ||
| − | [[Image:MG1.jpg| | + | [[Image:MG1.jpg|800px]] |
== Social Comparison == | == Social Comparison == | ||
Social comparison is implemented in two ways: 1) Me vs group, which compares an individual learner’s progress or knowledge level with the entire group of students, and 2) Me vs other students, which compares an an individual learner’s progress or knowledge level with each of other students. Such comparisons can be further conducted by resource types (learning materials) as shown in following figure. | Social comparison is implemented in two ways: 1) Me vs group, which compares an individual learner’s progress or knowledge level with the entire group of students, and 2) Me vs other students, which compares an an individual learner’s progress or knowledge level with each of other students. Such comparisons can be further conducted by resource types (learning materials) as shown in following figure. | ||
| − | [[Image:MG2.jpg| | + | [[Image:MG2.jpg|800px]] |
== Adaptive Navigation Support == | == Adaptive Navigation Support == | ||
| Line 27: | Line 27: | ||
== Resources == | == Resources == | ||
| − | * Try an interactive demo of Mastery Grids [ | + | * Try an interactive demo of Mastery Grids [ here]. |
| − | * Read a slide presentation about Mastery Grids [http://www.slideshare.net/pbrusilovsky/ectel2014-mg here]. | + | * Read a slide presentation about Mastery Grids [http://www.slideshare.net/pbrusilovsky/ectel2014-mg here]. Log in with adl01 as you UID and PWD. |
* Download the source code [https://github.com/PAWSLabUniversityOfPittsburgh/mastery-grids here]. | * Download the source code [https://github.com/PAWSLabUniversityOfPittsburgh/mastery-grids here]. | ||
| Line 35: | Line 35: | ||
* Loboda, T., Guerra, J., Hosseini, R., and Brusilovsky, P. (2014) Mastery Grids: An Open Source Social Educational Progress Visualization. In: S. de Freitas, C. Rensing, P. J. Muñoz Merino and T. Ley (eds.) Proceedings of 9th European Conference on Technology Enhanced Learning (EC-TEL 2014), Graz, Austria, September 16-19, 2014 (Best paper award). ([http://link.springer.com/chapter/10.1007%2F978-3-319-11200-8_18#page-1 paper]) ([http://www.slideshare.net/pbrusilovsky/ectel2014-mg presentation]) | * Loboda, T., Guerra, J., Hosseini, R., and Brusilovsky, P. (2014) Mastery Grids: An Open Source Social Educational Progress Visualization. In: S. de Freitas, C. Rensing, P. J. Muñoz Merino and T. Ley (eds.) Proceedings of 9th European Conference on Technology Enhanced Learning (EC-TEL 2014), Graz, Austria, September 16-19, 2014 (Best paper award). ([http://link.springer.com/chapter/10.1007%2F978-3-319-11200-8_18#page-1 paper]) ([http://www.slideshare.net/pbrusilovsky/ectel2014-mg presentation]) | ||
* Brusilovsky, P., Somyurek, S., Guerra, J., Hosseini, R., and Zadorozhny, V. (2015) The Value of Social: Comparing Open Student Modeling and Open Social Student Modeling. In: F. Ricci, K. Bontcheva, O. Conlan and S. Lawless (eds.) Proceedings of 23nd Conference on User Modeling, Adaptation and Personalization (UMAP 2015), Dublin, Ireland, , June 29 - July 3, 2015, Springer Verlag, pp. 44-55 ([http://d-scholarship.pitt.edu/26046/ paper] [http://www.slideshare.net/huangyun/2015-edm-leopard-for-adaptive-tutoring-evaluation presentation]) | * Brusilovsky, P., Somyurek, S., Guerra, J., Hosseini, R., and Zadorozhny, V. (2015) The Value of Social: Comparing Open Student Modeling and Open Social Student Modeling. In: F. Ricci, K. Bontcheva, O. Conlan and S. Lawless (eds.) Proceedings of 23nd Conference on User Modeling, Adaptation and Personalization (UMAP 2015), Dublin, Ireland, , June 29 - July 3, 2015, Springer Verlag, pp. 44-55 ([http://d-scholarship.pitt.edu/26046/ paper] [http://www.slideshare.net/huangyun/2015-edm-leopard-for-adaptive-tutoring-evaluation presentation]) | ||
| + | * Guerra, J., Hosseini, R., Somyurek, S., & Brusilovsky, P. (2016, March). An intelligent interface for learning content: Combining an open learner model and social comparison to support self-regulated learning and engagement. In Proceedings of the 21st International Conference on Intelligent User Interfaces (pp. 152-163). ACM. ([https://dl.acm.org/citation.cfm?id=2856784 paper]) | ||
| + | * Barria-Pineda, J., Guerra, J., Huang, Y., & Brusilovsky, P. (2017, March). Concept-level knowledge visualization for supporting self-regulated learning. In Proceedings of the 22nd International Conference on Intelligent User Interfaces Companion (pp. 141-144). ACM. ([https://dl.acm.org/citation.cfm?id=3038262 paper]) | ||
Latest revision as of 01:20, 7 May 2025
Mastery Grids is an open social learner modeling interface written in Javascript. The interface shows the student's progress or knowledge in topics or content types comparing with other learners, and provides navigation support to access suitable educational content.
Contents
Open Social Learner Model
Mastery Grids is a personalized educational system built to support practice with multiple types of smart learning content. Mastery Grids interface offers topic-based open learner modeling, which integrates features explored on our past successful systems (e.g., InterBook, QuizGuide, NavEx, QuizMap, Progressor). Combining open learner model with social comparison, i.e., open social learner model, Mastery Grids makes students aware of the strength and weakness of their own knowledge on the system topics and allows them to compare their knowledge with the knowledge of their peers. Our open social learner model encourages students to catch up with other students (observing average class progress or advanced students’ progress) and follow the potential good learning path of their peers.
Knowledge and Progress Visualization
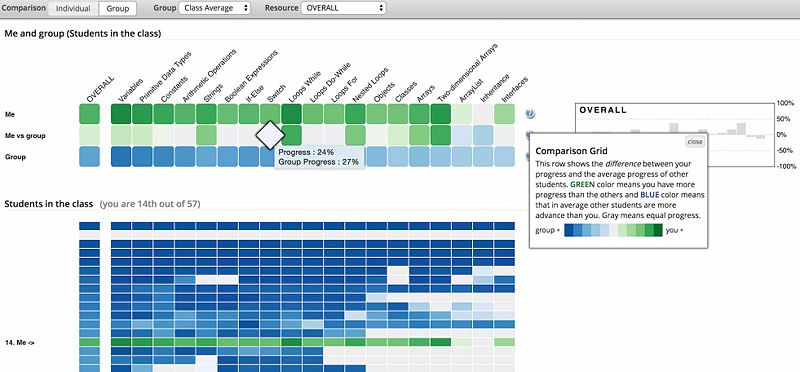
Mastery Grids presents and compares user learning progress and knowledge level (mastery) by colored grids from four perspectives as shown in the following figure. The four perspectives show the current student’s progress (“Me” or my progress), a comparison of performance of current student versus other student in the group (“Me vs group” or comparison grid), performance of the students in the group (“Group” or group grid), and performance of all of the students in the class.
Social Comparison
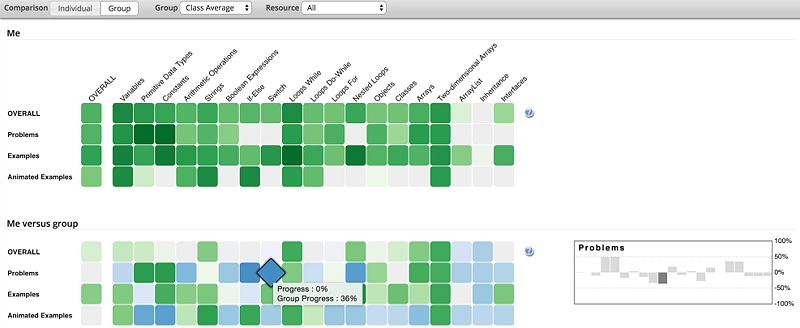
Social comparison is implemented in two ways: 1) Me vs group, which compares an individual learner’s progress or knowledge level with the entire group of students, and 2) Me vs other students, which compares an an individual learner’s progress or knowledge level with each of other students. Such comparisons can be further conducted by resource types (learning materials) as shown in following figure.
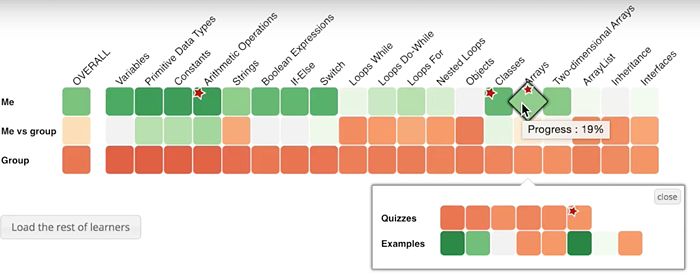
Mastery Grids also provides adaptive navigation support for learning materials (as shown in following figure with stars indicating the recommendations). It tracks user activities and updates student knowledge level in a centralized user modeling server, and thus can report in both progress level (based on activities) and knowledge level (based on estimated user knowledge). It provides flexible user-centered navigation across different content levels (e.g. topic, each content type) and different content types (e.g. problem, animated example) and tracks user feedbacks on recommendations dynamically. Details of user modeling can be found here. Details of the personalization (recommendation) can be found here.
Videos
- Watch a video about Mastery Grids interface here.
- Watch a video about Mastery Grids with adaptive content sequencing here.
- Watch a video about Mastery Grids content types in Java domain here.
- Watch a video about Mastery Grids content types in Python domain here.
- Watch a video about Mastery Grids content types in SQL domain here.
Resources
- Try an interactive demo of Mastery Grids [ here].
- Read a slide presentation about Mastery Grids here. Log in with adl01 as you UID and PWD.
- Download the source code here.
Publications
- Loboda, T., Guerra, J., Hosseini, R., and Brusilovsky, P. (2014) Mastery Grids: An Open Source Social Educational Progress Visualization. In: S. de Freitas, C. Rensing, P. J. Muñoz Merino and T. Ley (eds.) Proceedings of 9th European Conference on Technology Enhanced Learning (EC-TEL 2014), Graz, Austria, September 16-19, 2014 (Best paper award). (paper) (presentation)
- Brusilovsky, P., Somyurek, S., Guerra, J., Hosseini, R., and Zadorozhny, V. (2015) The Value of Social: Comparing Open Student Modeling and Open Social Student Modeling. In: F. Ricci, K. Bontcheva, O. Conlan and S. Lawless (eds.) Proceedings of 23nd Conference on User Modeling, Adaptation and Personalization (UMAP 2015), Dublin, Ireland, , June 29 - July 3, 2015, Springer Verlag, pp. 44-55 (paper presentation)
- Guerra, J., Hosseini, R., Somyurek, S., & Brusilovsky, P. (2016, March). An intelligent interface for learning content: Combining an open learner model and social comparison to support self-regulated learning and engagement. In Proceedings of the 21st International Conference on Intelligent User Interfaces (pp. 152-163). ACM. (paper)
- Barria-Pineda, J., Guerra, J., Huang, Y., & Brusilovsky, P. (2017, March). Concept-level knowledge visualization for supporting self-regulated learning. In Proceedings of the 22nd International Conference on Intelligent User Interfaces Companion (pp. 141-144). ACM. (paper)


